The totally free
SeaClear II PC based chart plotter with totally free NOAA navigation
charts
You supply the laptop, netbook or pc and the gps that feeds it
(Click on the images for larger versions)
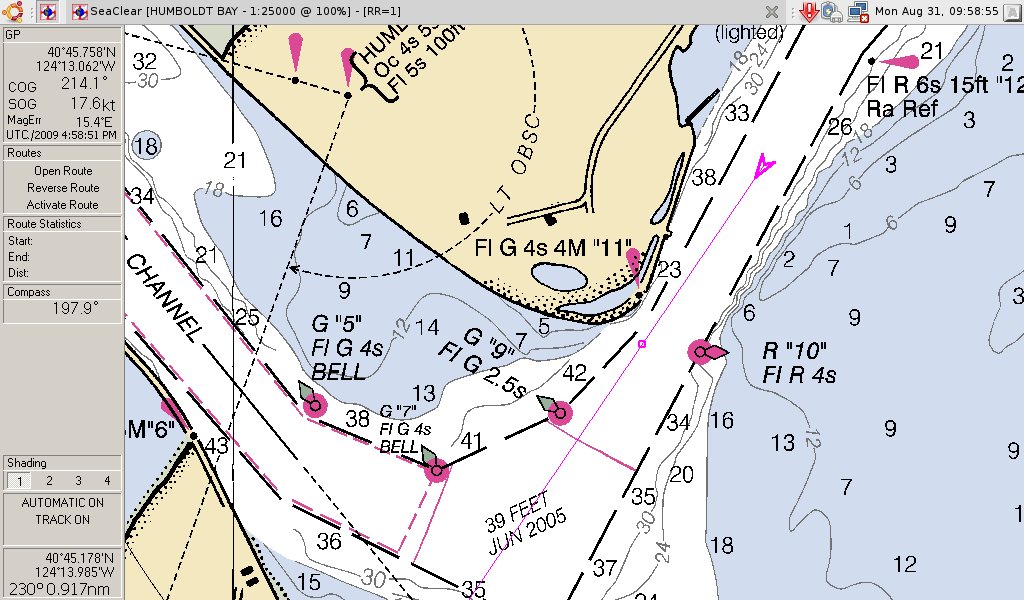
Screen shot made
while under way of the
approach outbound to the Humboldt Bay Entrance bar from the little EEE
PC901
netbook running SeaClear II fed with a Garmin GPSMAP 60CS
handheld. The symbold of the boat is the arrow, and the course
line from the bow shows a small dot near the rock corner of the spit
which is where the boat will be in 60 seconds. Stomper's guidance
GPS is an Eagle Cuda 250 S/Map chart
plotting fish finder used for waypoint and route navigation while the
SeaClear unit is used for situational awareness since it's detail is
greater than the Eagle plotter. The portable aspect of SeaClear
is useful for in-home review of the day's fishing tracks and for
planning and reviewing your plans for those future tuna trips.
Stomper's third chart plotter is on the GPSMAP 60CS that feeds the
SeaClear II plotter with NMEA 0183 data. I rarely use the Garmin
as a chart plotter because it's screen is so small.
This information is not really for those of you with the resources to
have the best standalone dedicated chart plotters on your very nice
ocean going boats. This is more for someone who doesn't have one but
maybe has an old laptop laying around and can be resourceful enough to
find a handheld or usb gps device to feed it information. If you
just need a chart on your vessel and don't have the room to roll out a
paper chart, you can use this for that. The power is released
when it is interfaced with a gps unit.
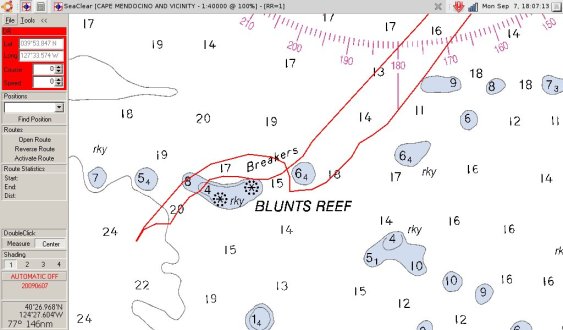
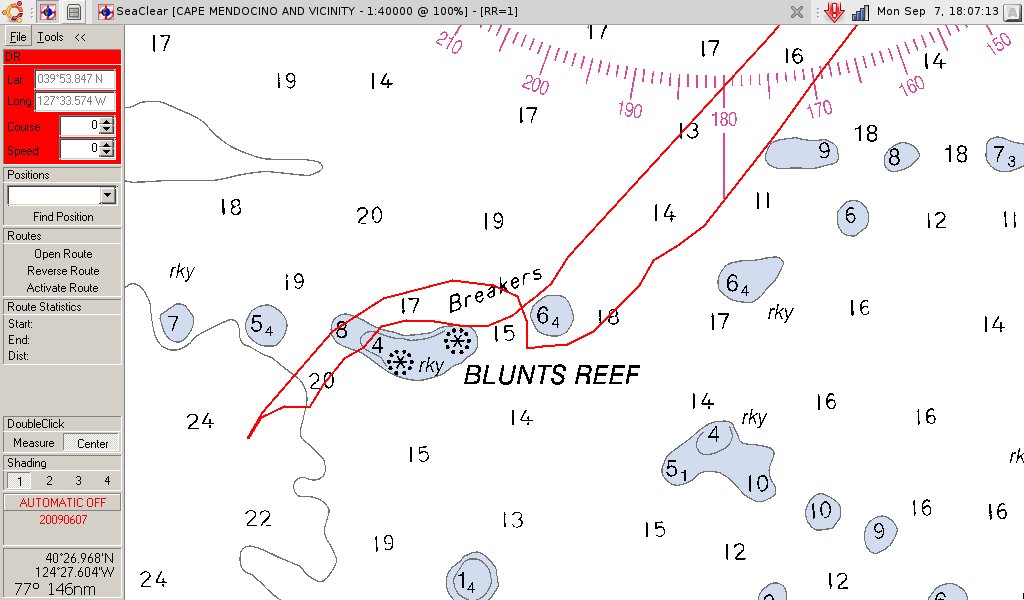
Here's a recorded track from a Cape trip I did with some time
spent at Blunts Reef. I caught a halibut at the tip of that track
by the 24 fathom mark, and rockfish after that on the reef. These
locations are exactly as I encountered them. In other words, very
accurate. I found that all of the submerged pinnacles show on the fish
finder when I passed over them on this plotter.
The Sea Clear II chart plotter is a totally free, freeware chart
plotter that is an excellent addition to any vessel wheel house as a
backup system, a primary chart plotter, or as a second chart plotter
that you can take into your house after a trip and review your day's
trip
track. It's also a good program to have on the home computer to
view tomorrow's tuna expedition. It uses freely available
electronic navigation raster
charts from NOAA that are up to date and officially qualified as marine
navigation charts.. The guy who wrote it did so
because he couldn't find one for free. He wrote this program and
has been working on it for years, and it is an amazing piece of work
considering he doesn't charge for it, and it's great
functionality.
I've included many screen shots of the program. It works
fabulously in the new 8.9 inch and 10 inch netbook portables now on the
market for as little as 250 bucks. I use a 300 dollar Asus EEE
901 with a 16 gig solid state drive and a 35 dollar GPS USB
dongle. It's rugged, but the key board can't tolerate water
drops. Ask me how I know. It cost me 16 bucks to replace
the key board. I now protect the keyboard with cellophane
wrap. I have a complete collection of charts installed
in it covering Southern California, Northern California and Oregon but
have omitted the San Francisco and Central California areas until I
plan to operate there. All
of this at no cost other than the netbook and the gps unit that feeds
it.

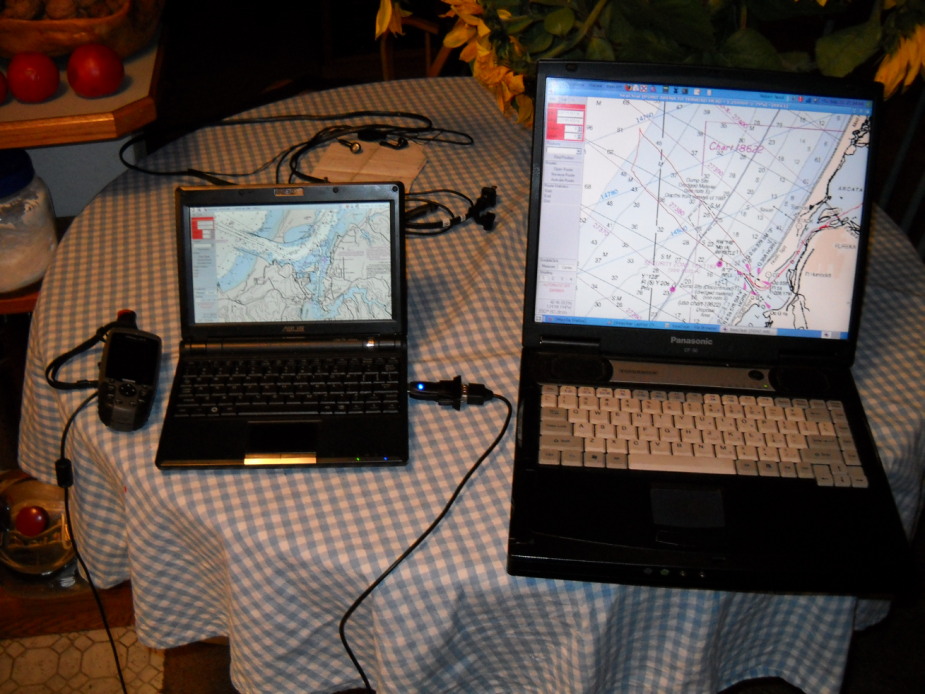
These are the two laptops I use on Stomper. The Asus EEE
PC901 300 dollar netbook is on the left and the Panasonic CF-50
Toughbook that I bought for 275.00 is on the right. I use the
smaller one 95 percent of the time since Stomper is nothing more than a
large jetski at 15 feet 10 inches. Note the plot at the right is
chart 18620 on the Toughbook showing a track from the jaws to the
halibut grounds near the 51 line. The little netbook on the left
has the Garmin GPSMAP 60CS attached as it usually is on the boat
feeding NMEA 0183 location data to the netbook. It is showing the
Coos Bay bar. These can be zoomed in to very closeup views while
under way. The red location and speed status box on the upper
left of each screen are red because neither is recieving real time NMEA
0183 data. When the data feed is active, the red window becomes
pale blue like the rest of the window and the box shows real time
location, speed, course over ground and UCT time data. This is a
fully featured and functional chart plotter. I will soon be
adding a GPS USB dongle so that the netbook will be "standalone"
portable without the Garmin hanging by a cable from it. The GPS
dongle will just stick out of one of the USB ports.
This is a fully capable stand alone chart plotter that can be
configured to run on the laptop without external connections other than
maybe a cigarette lighter plug charging adapter or something like that.
The program should work in almost any laptop that can run Windows 98
through today's Vista and Windows 7. I personally use Linux to
run the program, the details of which I won't go into unless by special
request. I'll just say that even though it's written for Windows,
it works just as well in today's versions of the various distributions
of the Linux operating systems thanks to additional work by the author
of the software. The normal computer user would use Windows and
the setup and use of the program is very straight forward.

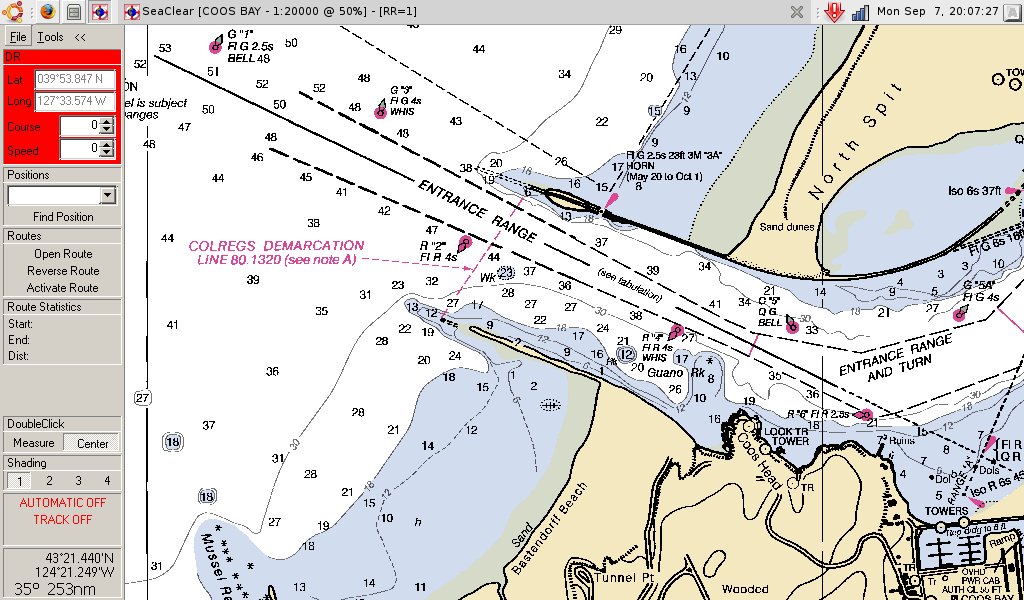
Details of the Coos Bay Bar entrance. Again, the red box
at the left above means no NMEA 0183 output is getting to the plotter
because I simply had the laptop in my house and brought this chart up
manually instead of letting the plotter do it automatically, which it
would if we were underway with a GPS in that area attached and feeding
the plotter.
The beauty of this thing is many fold. It's cheap, it's good,
it's easy to operate, and nice to have. It beautifully navigates
all the narrow underwater channels of Humboldt Bay so you don't ground
in a mud flat. You could have it on an ultra portable netbook
style 250 dollar laptop, use a 35 dollar GPS USB dongle unit plugged
into the USB port, and record your next tuna trip while on somebody
else's boat. It's as precise as any dedicated chart plotter
too. You could also have an on board pc box stashed somewhere on
the boat driving any size flat screen display you want, even a huge
one, giving you a
fully functional chart plotter with legal navigation charts. Very
small cube sized pc modules can be had intended for auto use that use
12 volts DC that would be perfect for this program. If you've
never owned a chart plotter and have the laptop and a gps with NMEA
0183 output capabilities and you navigate the bay with a small aluminum
boat, you could put this on board and be able to fully view the bottom
profiles.
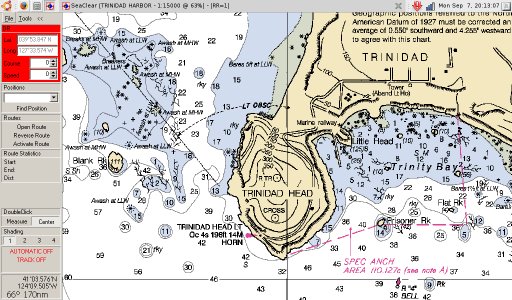
Trinidad Head and Trinity Bay
Have you ever had a GPS chart plotter unit screw up, fail or have an
electrical system failure disabling nav systems? This unit with a
GPS USB dongle can guide you into Humboldt Bay, Coos Bay or wherever
you are if the proper chart is loaded. It also can use normal
NMEA 0183 output from any GPS device that can output that format and it
will use it as the location information. The plotter can
also output the same NMEA 0183 data to an autpilot or whatever might
use the information. If the charts are properly loaded into the
program, the program will keep the proper chart moving under your
vessel symbol, and it will automatically switch to the highest detail
chart based on where it knows you are. If you are coming into
Humboldt Bay and are on the 18620 electronic chart (free from NOAA),
then as soon as you enter the border of the 18622 chart for Humboldt
Bay, the plotter will automatically switch to the 18622 Humboldt Bay
chart
with no action from you.
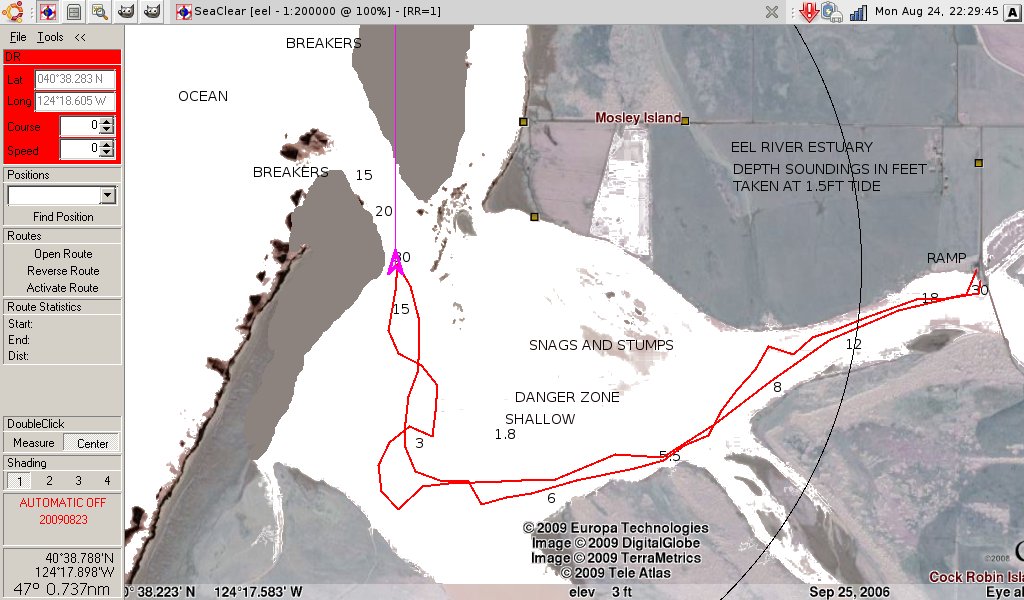
As explained later, I created a chart
image for the Eel River estuary from an aerial photographic image,
calibrated the image with lat and lon info and loaded it into the
program. Now, if I approach the Eel River mouth and get close to
it, the plotter will automatically switch to that chart because it is
more detailed. How cool is that?
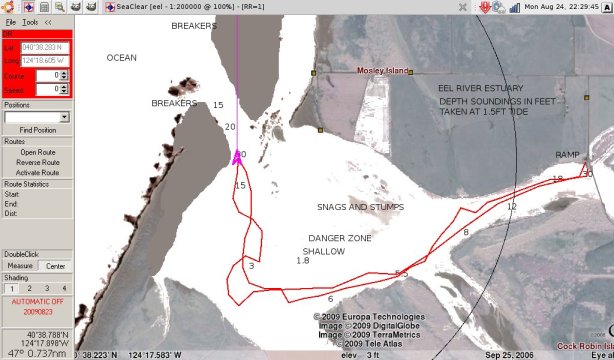
I made this chart from a Google Earth screenshot and calibrated
it using SeaClear's MapCal program which is included in the
download. You can obtain the upper left and bottom right
coordinates while in Google Earth and then use them for the
calibration. You can use two
known coordinates within the image and after two of them are entered on
the image, it will be fully calibrated. After I
did this, during one of the recent wind blowouts preventing ocean
fishing, I launched Stomper into the estuary and did some bottom
mapping with
the goal of having a little more information for those adventurous
ocean entries from this location for trips to the Cape. It is
evident that it is an accurate calibration because you can see where I
launched the boat at the ramp, and it's dead-spot-on. I've used
this ocean entry before but it's not for everyone. It can be
dangerous returning in fog with no nav aids to mark anything. You
absolutely MUST know about surf and how waves work. I've surfed
for 45 years and am fairly comfortable in the surfline whether on a
board or in a boat. The track
shown here is one of those mapping missions taking depth soundings and
documenting them. This opens up the possiblity for any lake or
river to be charted this way and used in this program.
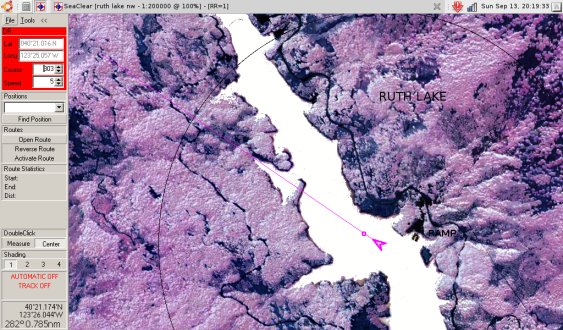
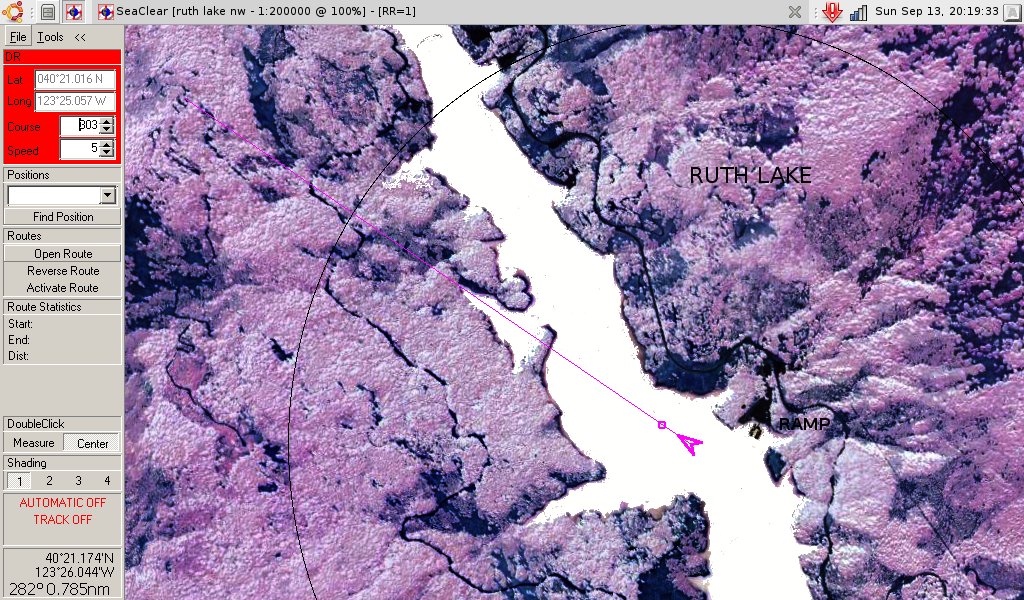
So, I just did the same with the northwest half of Ruth
Reservoir. No depth markings yet though. I'll have to do
that one of these days when I get the boat up there. I wasted a
bunch of time making the mistake of not orienting the image with North
up, so my calibration of the chart failed big time and the result was
really wierd. this is a corrected version and works really
well. SeaClear II is a "North-Up" only chart plotter. It
does not twist the map around so you are "course-up". I manually
set the vessel speed at 5 mph at 303 degrees magnetic, so that dot in
front of the vessel symbol shows where I'll be in 60 seconds. The
author says that he is working on making that change. Again, I inverted
the color of the image and then filled in the lake with white so it
would be much easier to see on the laptop screen in the day time.
This will be a pretty neat fishing tool and just a real neato "gee-wiz"
thing to have on the lake. I'm going to do this for the Klamath
River also.
My fourth directional source is my dead reckoning
magnetic compass, stop watch and low/medium frequency radio direction
finders ( ancient old school stuff I learned in the sixties).
The Charts
The Sea Clear II plotter uses the NOAA raster charts that are free from
the government online. These are the electronic versions of the
same charts as you buy in the marine supply stores. For instance,
the plotter uses chart 18622 for Humboldt Bay, chart 18623 for Cape
Mendocino and viscinity, chart 18620 for Point Arena to Trinidad
Head, and chart 18605 for Trinidad Harbor. To find them just
Google search for "NOAA navigation charts". As you route your way
into the chart site, it might appear that you have to order and pay for
something, but that's not the case. Just follow instructions for
downloading your charts, and you'll end up with a zip file of the
charts you wanted, and then you can put them somewhere that you will
remember where they are. Loading them into the plotter so they'll
do their automatic thing while your GPS is attached is a little wonky,
but we'll get into the details later.
You can also create, load and use your own custom made charts.
The program can use any image file as a chart, and includes a program
that is used to load the image and calibrate the top left and bottom
right corners of the image with lat and lon coordinates so that it will
be a fully functional chart. I created a chart of the Eel River
Estuary and Ruth Lake by screen capturing a Google Earth image of the
estuary and
obtaining the top left and bottom right coordinates using the Google
Earth cursor, and then using that information to do a very simple
calibration of the image. The image was saved as a chart, and
then it functioned perfectly during a mapping recon mission I did of
the estuary during unfishable weather conditions in the ocean. I
was curious about the estuary as an ocean entry point, as I have used
it in the past to go into the ocean. I've never been able to find
any bottom information chart sources for it though.
More screen shots.
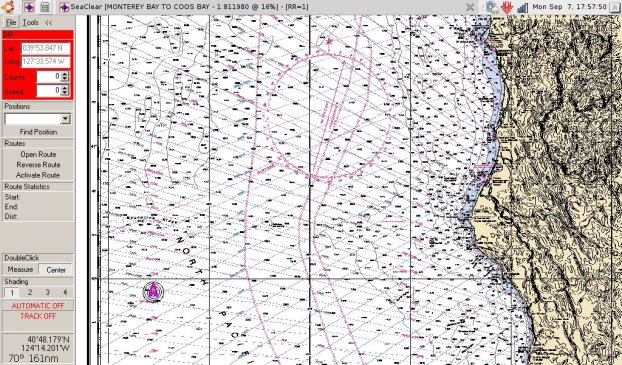
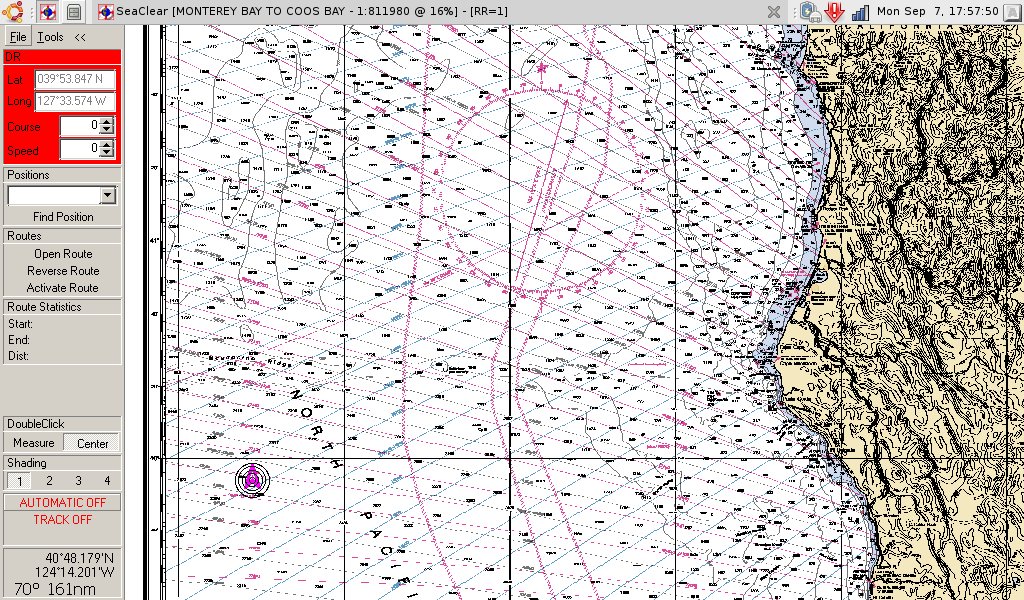
Here's what it would look like if you were fishing 161 nautical
miles at 235 degrees magnetic from the Humboldt Bay Bar entrance.
This is the Monteray Bay to Coos Bay chart. Not alot of detail
but it covers a huge area. I have too many charts to mention on
the little netbook laptop.
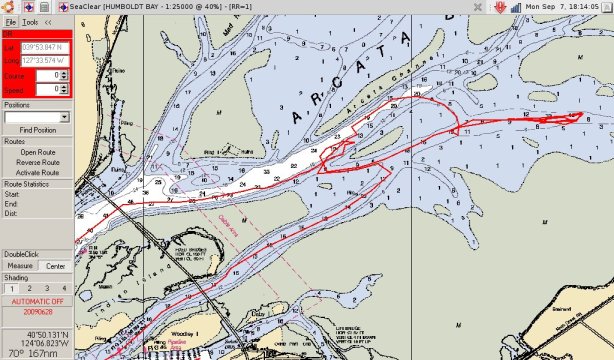
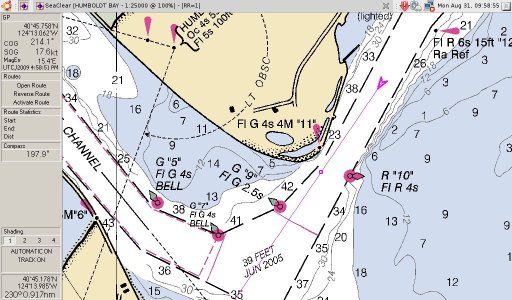
A Halibut hunt in the bay. As you can see, this is very handy for
finding the deeper channes to get from one channel to another. It
is the only good way in conjunction with a depth sounder to avoid
grounding in the mud. The tracks here were not sampling fast
enough to show smooth curves because I had the program misconfigured at
the time. It has since been corrected.
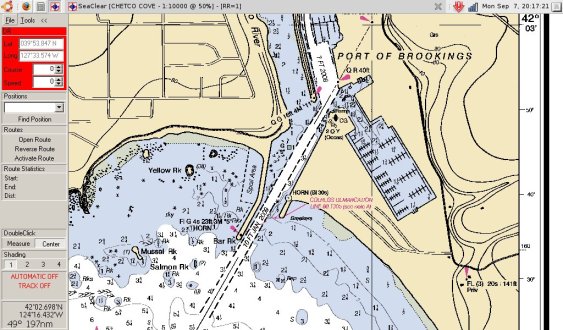
The Brookings Harbor entrance.
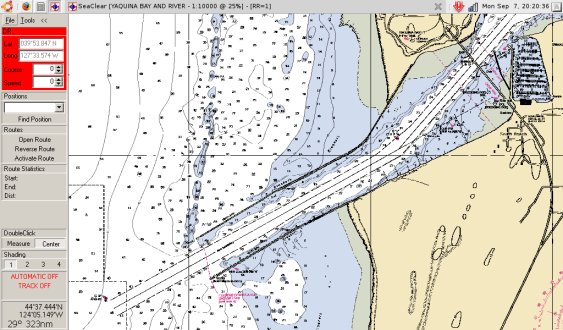
Yaquina River, Newport, Oregon. This is supposed to be a pretty
gnarly bar.
I'll be working a little more on this, but all you have to do is Google
search for SeaClear II and it will come up for you. Good luck.